What Your Electric Bill Is Really Costing You
Most homeowners think about the electric bill one month at a time. The bigger picture looks very different.
The national average residential electricity rate has climbed 21% over the past five years, rising from 14.92¢/kWh in 2022 to 18.05¢/kWh in 2026. That sustained increase is driven by rising natural gas prices, grid modernization costs, and surging power demand from data centers and EV adoption. None of those pressures are going away.
Here is what that means for a homeowner paying $175 a month today, assuming a conservative 4% annual rate increase:
That is roughly $87,000 paid to a utility company over 25 years, with nothing to show for it.
A properly sized solar system, by contrast, locks in a predictable payment and can save the average homeowner $40,000 or more over the life of the panels.
Solar Energy World serves homeowners in Maryland, New Jersey, Virginia, Washington D.C., Delaware, Pennsylvania, and Florida, all states where utility rates run at or above the national average. The higher your current rate, the faster solar pays for itself.

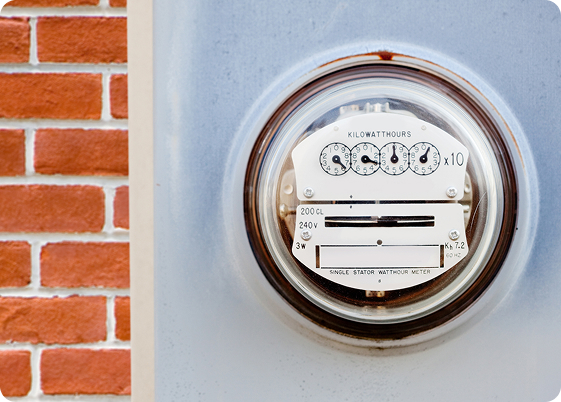
How to Read Your Electric Bill for Solar Planning
To get an accurate savings estimate from any solar calculator, you need two numbers from your electric bill: your monthly kWh usage and your rate per kWh.
Here is where to find them.
Monthly kWh usage is usually labeled “electricity used,” “kWh consumed,” or “total usage” on your bill. It shows how much energy your home pulled from the grid that month. The average U.S. home uses around 843 kWh per month, but usage varies by home size, season, and how much cooling or heating runs on electricity.
Rate per kWh is labeled “energy charge,” “supply rate,” or “cost per kWh.” In states like Maryland, New Jersey, and Pennsylvania, you may see two separate charges: a supply charge (the cost of the electricity itself) and a delivery charge (the cost of transmitting it to your home). Both add up to your total effective rate.
If you are not sure what your rate is, a good starting point is the state average:
- Maryland: ~19¢/kWh
- New Jersey: ~18–20¢/kWh
- Washington D.C.: ~19–21¢/kWh
- Virginia: ~14–16¢/kWh
- Pennsylvania: ~18¢/kWh
- Delaware: ~15–17¢/kWh
- Florida: ~13–16¢/kWh
One note worth knowing: when Solar Energy World runs a free solar analysis for your home, we ask to see your actual electric bill. This is not just to get your monthly total. It gives us your usage history across all 12 months, your specific utility’s net metering policy, and the rate structure your household is on. That data is what makes a real savings estimate accurate, not just a ballpark. You can read more about why solar companies need your electric bill before giving a quote.
How the Calculator Estimates Your Savings
Our utility calculator uses four inputs to estimate what solar could save you each month and over time.
-
Monthly bill to kWh usage
Your bill amount, divided by your rate per kWh, gives us your monthly electricity consumption in kilowatt-hours. For example: a $175 bill at $0.19/kWh means your home uses about 921 kWh per month.
-
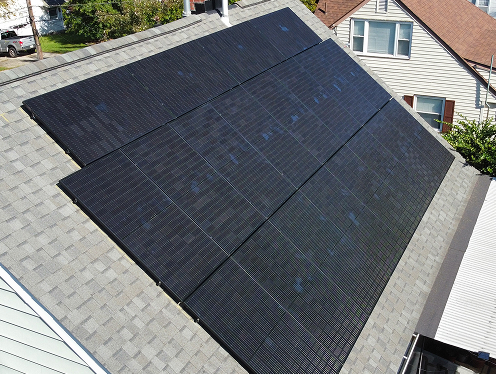
kWh to system size
We use your consumption, your ZIP code, and local solar production data from the National Renewable Energy Laboratory (NREL) to estimate what size system would offset your usage. A home using 921 kWh per month in Maryland typically needs a 6 to 8 kW solar system, depending on roof orientation and shade.
-
Savings estimate
We calculate how much of your bill the system would cover, factoring in your state’s net metering policy, which determines how your utility credits you for excess energy your panels send back to the grid.
-
Long-term projection.
We apply a 3 to 5% annual utility rate increase to show what staying on grid power is likely to cost you over 10 and 25 years, compared to owning a solar system.
Several factors affect your result:
- Roof orientation and pitch (south-facing roofs at 30–45 degrees produce the most)
- Amount of shade from trees or nearby structures
- Your state’s net metering rules
- Whether you add a solar battery, which improves savings when net metering credits are limited
- Seasonal usage patterns, since summer AC loads can be 30–50% higher than winter bills
The calculator gives you a strong planning estimate. A free professional analysis from Solar Energy World gives you a precise, site-specific number.
What Happens After You Use the Calculator
The calculator gives you a solid starting point. It tells you whether solar makes financial sense for your situation and roughly how much you could save. To get from estimate to installation, here is what comes next.
-
Free solar analysis
A Solar Energy World energy advisor reviews your electric bill, evaluates your roof using satellite data, and assesses your home’s solar potential. This is free and takes less than 30 minutes.
-
Custom system design
We design a system sized specifically for your home’s energy use, roof layout, and shading conditions. You get a detailed cost-benefit analysis showing your projected savings, payback period, and financing options.
-
Incentives and financing
We identify every state and local incentive that applies to your home, including net metering credits, sales tax exemptions, and property tax exemptions in your state. We handle all the paperwork.
-
Installation
Our certified installation team handles your system from permits through grid connection. Most residential installations take two to three days.
-
Monitoring
After installation, your system is monitored remotely so any performance issues are caught and addressed quickly.
Solar Energy World has been helping homeowners across Maryland, New Jersey, Virginia, DC, Delaware, Pennsylvania, and Florida go solar since 2009. We handle every step of the process, so you do not have to.
No pressure. No obligation. Just real numbers for your home.
Frequently Asked Questions
The calculator gives a strong planning estimate based on your bill, your location, and your shade level. It uses real solar production data from the National Renewable Energy Laboratory (NREL) and current utility rate information. Actual savings will vary based on your specific roof, local utility rate structure, and net metering policy. A free professional analysis from Solar Energy World will give you a precise figure.
You need your average monthly electric bill in dollars, your ZIP code, and an idea of how much shade your roof gets. If you have your rate per kWh handy from your electric bill, you can enter that for a more accurate result. If not, the calculator uses your state’s average.
Your bill contains 12 months of usage history, your specific rate structure, and your utility’s net metering details. Without it, any savings estimate is little better than a guess. Solar Energy World uses your bill to build a real cost-benefit analysis, not a marketing number. We have a strict privacy policy and do not share your information with anyone outside our organization without your permission.
In many cases, solar can offset 90 to 100% of your electricity usage. Whether your bill goes to zero depends on your system size, your usage patterns, and your utility’s net metering policy. In states with strong net metering like New Jersey and Maryland, homeowners can bank credits from daytime solar production to cover nighttime and winter usage. Adding a solar battery further improves your ability to use your own energy around the clock.
Newer roofs are actually ideal for solar installation since panels are typically warrantied for 25 years. If your roof has limited space or complex shading, our team designs around it, using higher-efficiency panels or adjusting system size to maximize what your roof can support. We evaluate every property individually.
More Maryland Financial
Incentives for Going Solar

See How Much You Could Save With Solar
Stop overpaying for electricity. Your personalized estimate takes just seconds.
Here is where to find them.